


based on a global ocean area of 0 km2
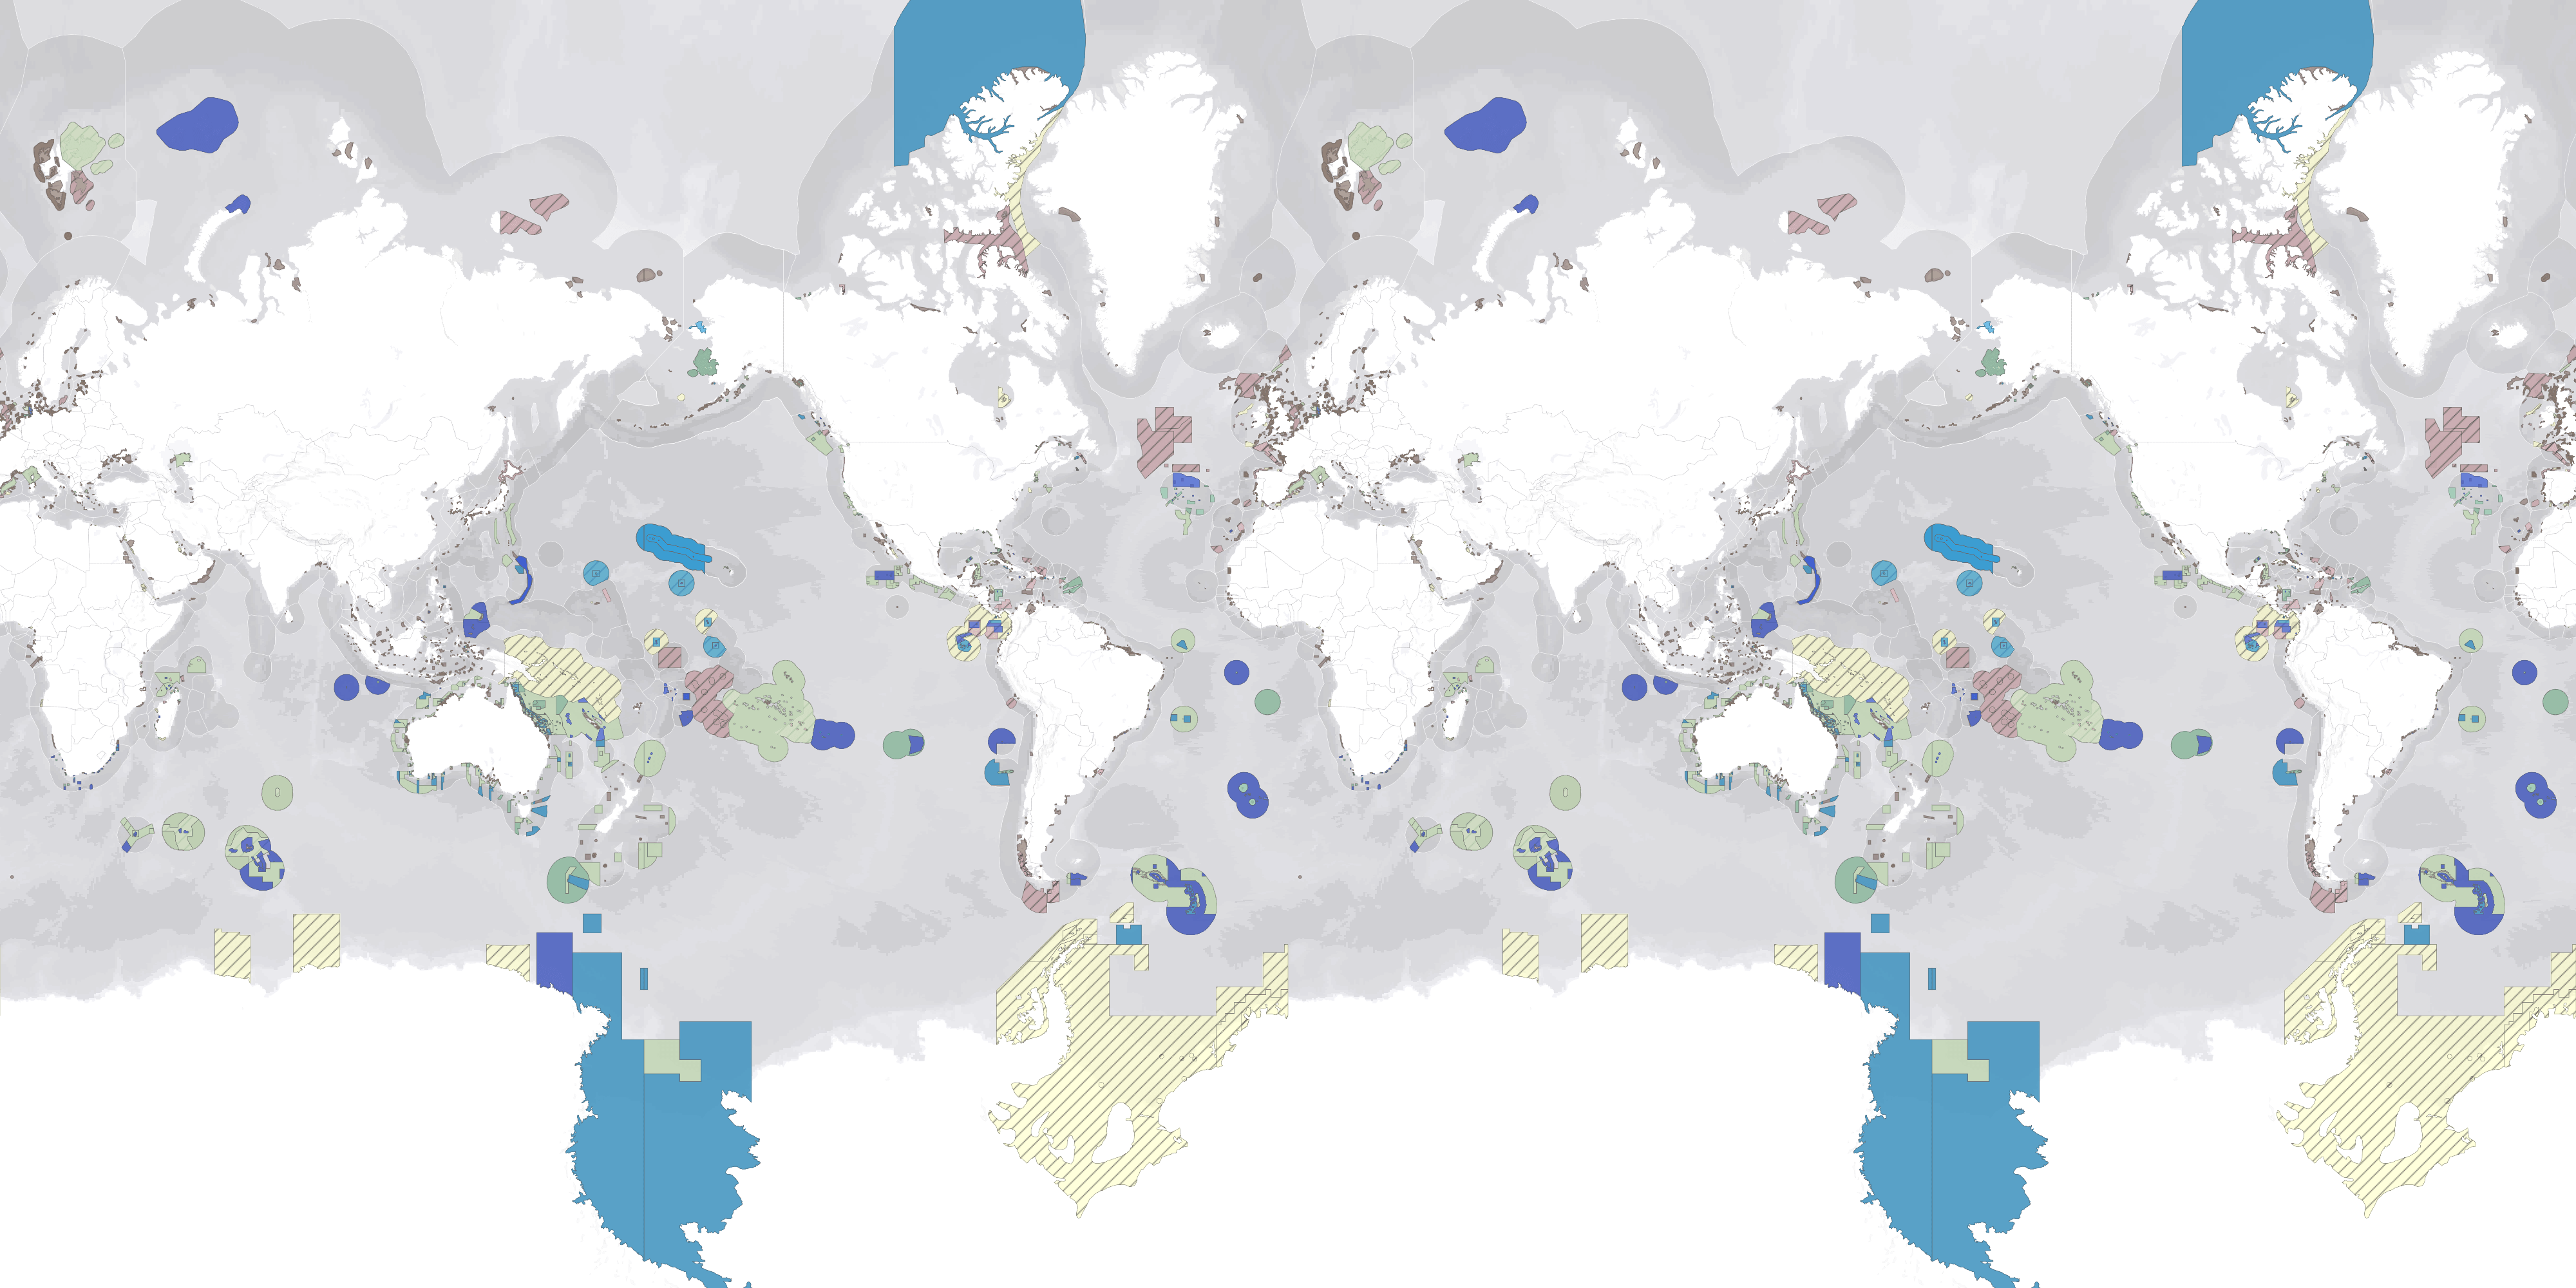
MPAtlas applies The MPA Guide to reported marine protected areas (MPAs) to calculate the area of global marine protection that is implemented on the water and fully or highly protected from direct human impacts. We compare this figure to the official MPA coverage reported by the World Database on Protected and Conserved Areas (WDPCA) at ProtectedPlanet.
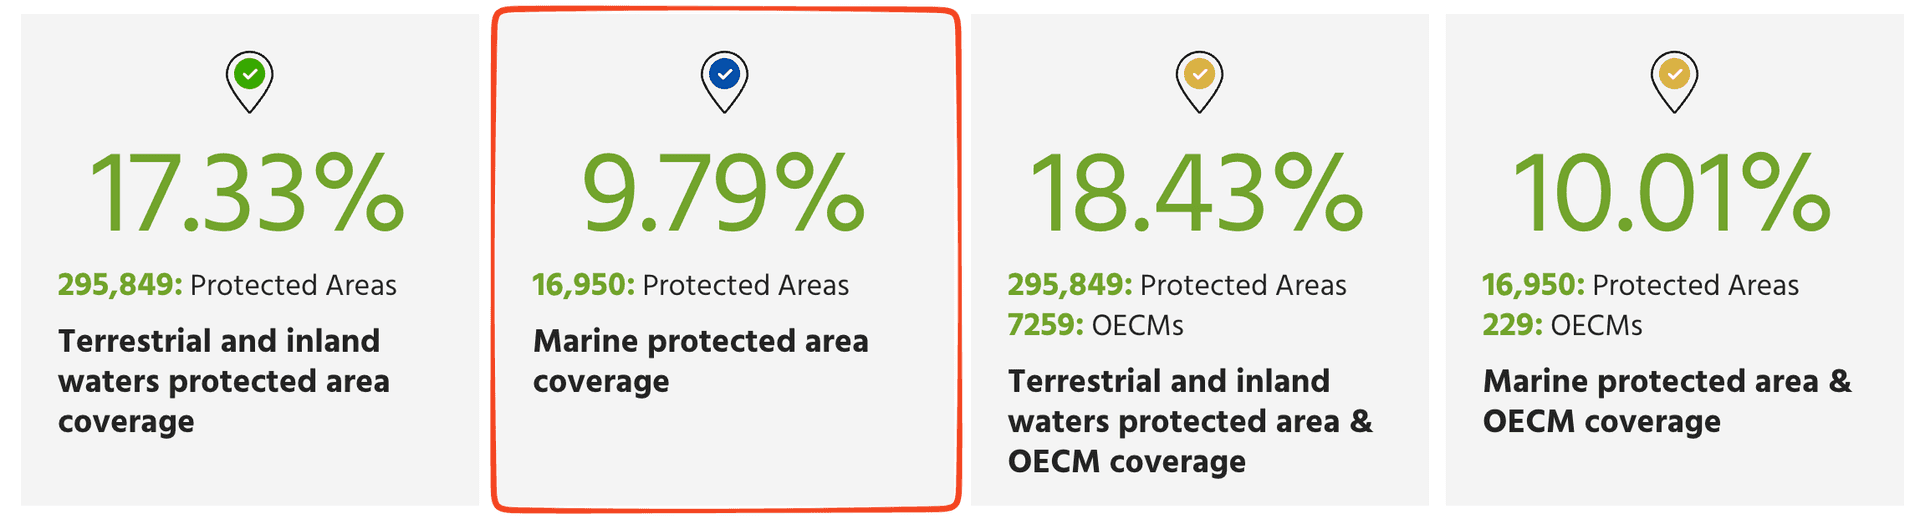
The 10% figure recently reported by the WDPCA refers to the reported coverage of both MPAs and Other Effective Conservation Measures (OECMs) towards the Global Biodiversity Framework Target 3. Although The Marine OECM Guide is currently under review and will be incorporated in MPAtlas in the future, our assessments currently include MPAs only. Therefore, at this time, we compare the area that is fully and highly protected only against the MPA area reported in the WDPCA.
You can read more about our MPA progress tracking here.

The Marine Protection Atlas (MPAtlas) is building a comprehensive global database of marine protection to identify, track, and advocate for fully and highly protected areas.
MPAtlas uses The MPA Guide's science-based framework to identify marine protected areas Stage of Establishment and Level of Protection, which are linked to expected conservation outcomes. MPAtlas shows how much of the ocean is currently fully or highly protected, highlights where MPAs are not yet implemented on the water, and much more. By focusing on the quality, in addition to the quantity, of marine protection, MPAtlas supports international progress toward effective marine conservation.
The MPAtlas assessment database is continually growing and will be regularly updated when new assessments are available. For visualization and data analysis, our assessment data is linked to geospatial boundaries from the World Database on Protected and Conserved Areas and other sources. The dataset does not contain boundaries for all global MPAs, only those that have been assessed.
The MPA Guide: a framework to achieve global goals for the ocean
The MPA Guide is a groundbreaking science-driven, policy-relevant framework to categorize marine protected areas and link their outcomes for nature and people.
MPA Guide assessment of marine protection


Blue Parks
Blue Parks aim to unite a global ocean refuge system of effective MPAs that covers 30% of the ocean to safeguard marine biodiversity. The Blue Park Criteria are science-based standards for conservation effectiveness, which provide blueprints for effective MPAs and a framework for evaluating the biodiversity benefits of MPAs. By awarding MPAs that meet the Blue Park Criteria, the Blue Parks initiative incentivizes and accelerates effective marine protection.
Learn more about Blue Parks.
34
marine protected areas have received Blue Park Awards.
These areas cover roughly 11.6% of the total marine protected area in the world.

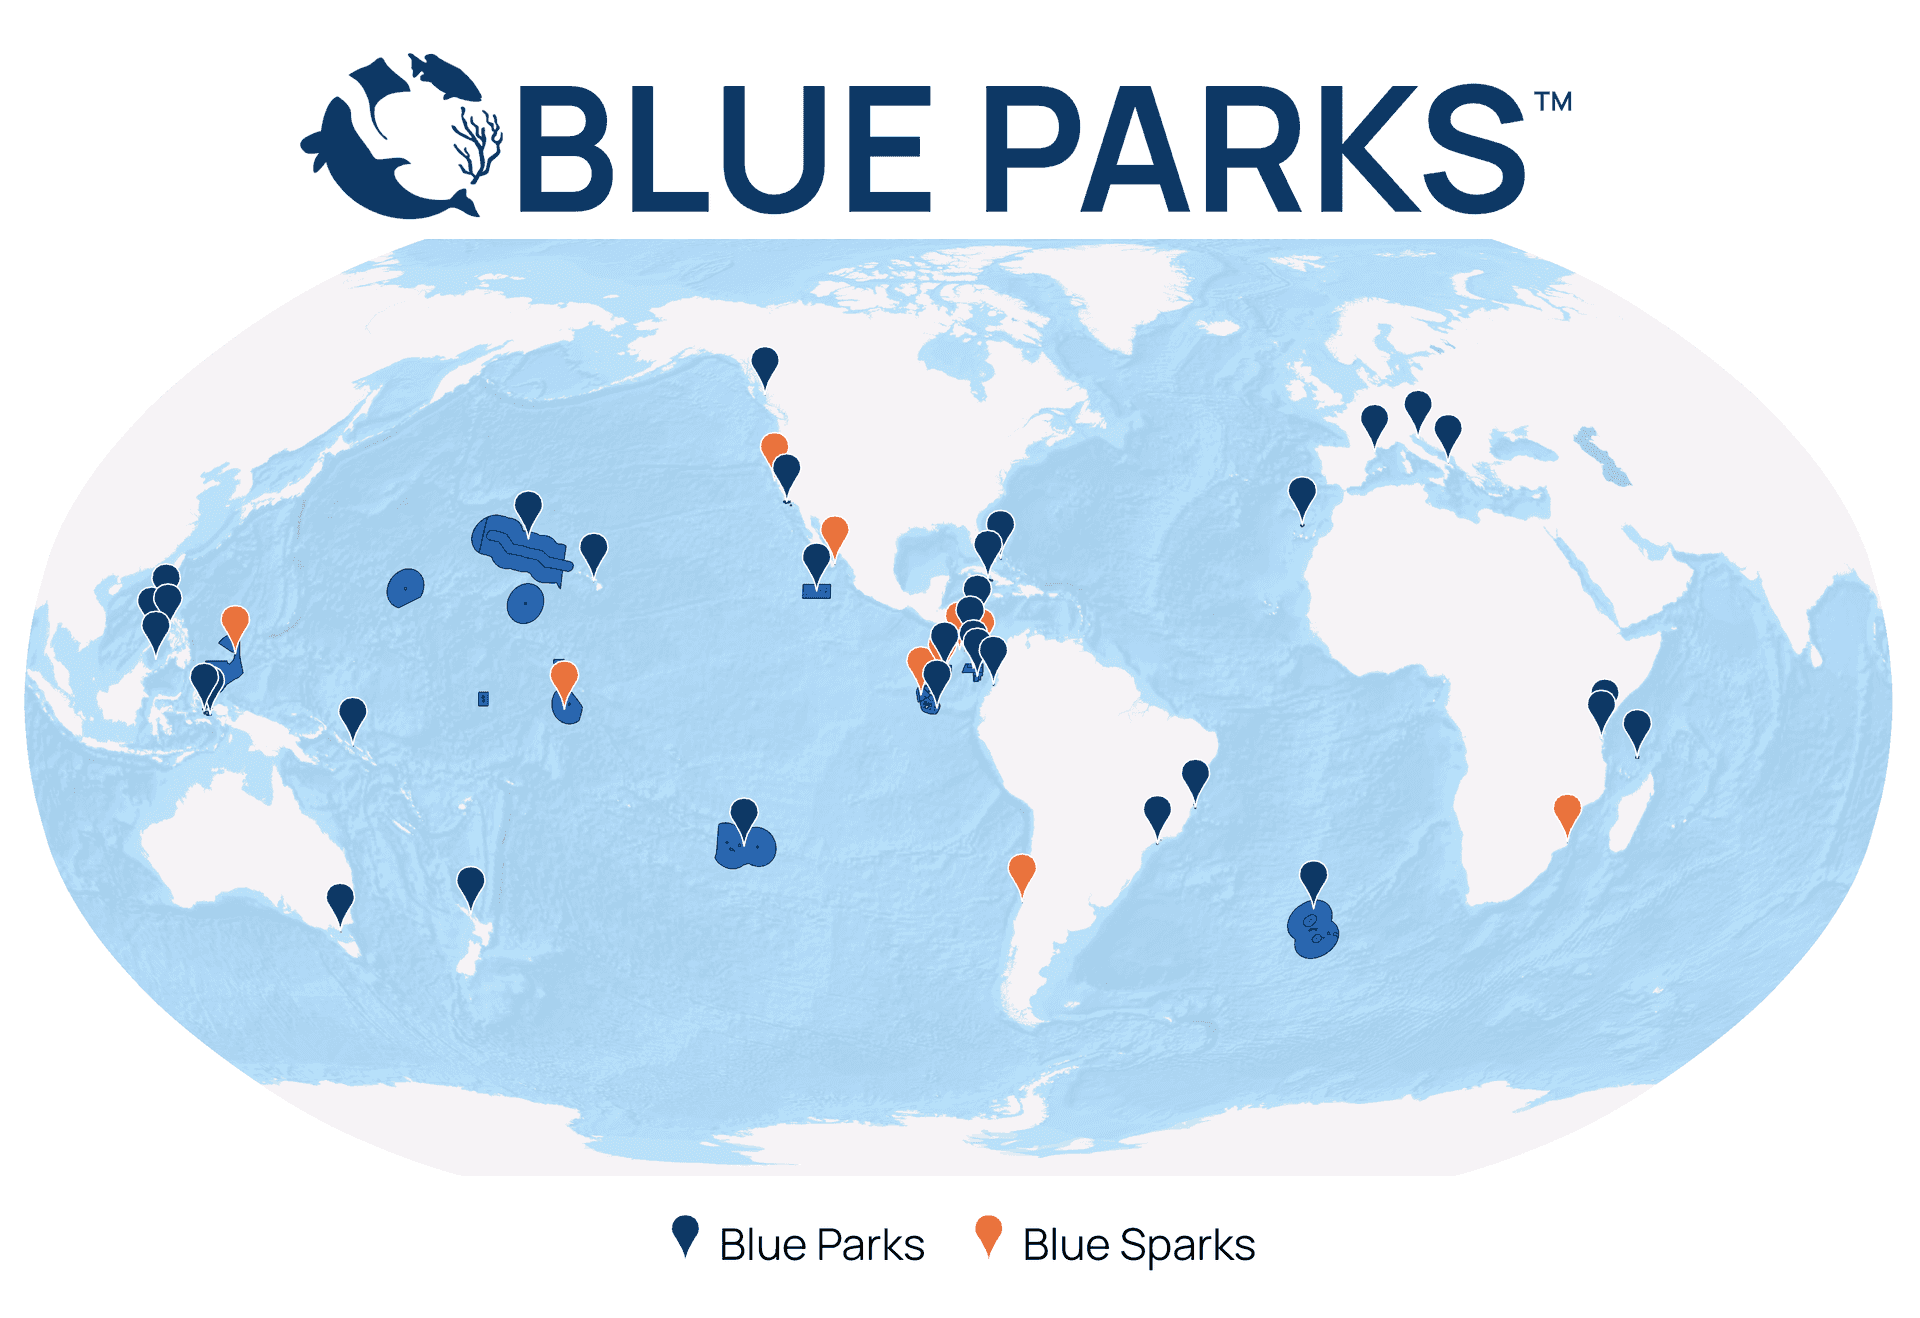
New Blue Parks in 2025
Four marine protected areas (MPAs) won prestigious Blue Park Awards for exceptional marine wildlife conservation at the UN Ocean Conference in 2025. Cahuita National Park (Costa Rica), Gorgona National Natural Park (Colombia), Kaho'olawe Island Reserve (Hawai'i, U.S.), and Shark Fin Bay MPA Network (Taytay, Philippines) join a growing network of 34 awarded Blue Parks around the global ocean that have met the highest science-based standards for conservation effectiveness. The four new Blue Parks cover a total area of 1,074 square kilometers. Their addition brings the Blue Park Network to a total of 3.5 million square kilometers of ocean area effectively protected in the waters of 23 countries.The Marine Protection Atlas is made possible through the generous support from:


It was created by the Marine Conservation Institute in partnership with Astute Spruce, LLC.